
Australia’s capital city home values have just fallen faster than at any point in more than 40 years. Cotality’s combined capitals index is down 8.1% over seven straight months to October (Cotality, November 2026). Nationally, values are 6.7% below their March peak, which takes roughly $63,400 off the value of the median dwelling (Cotality, November 2026).
That is a real correction, and nobody should pretend otherwise. It also isn’t the first one. If you’re holding property, or advising clients who are, it helps to look at how earlier downturns played out before reacting to this one.
How this downturn compares
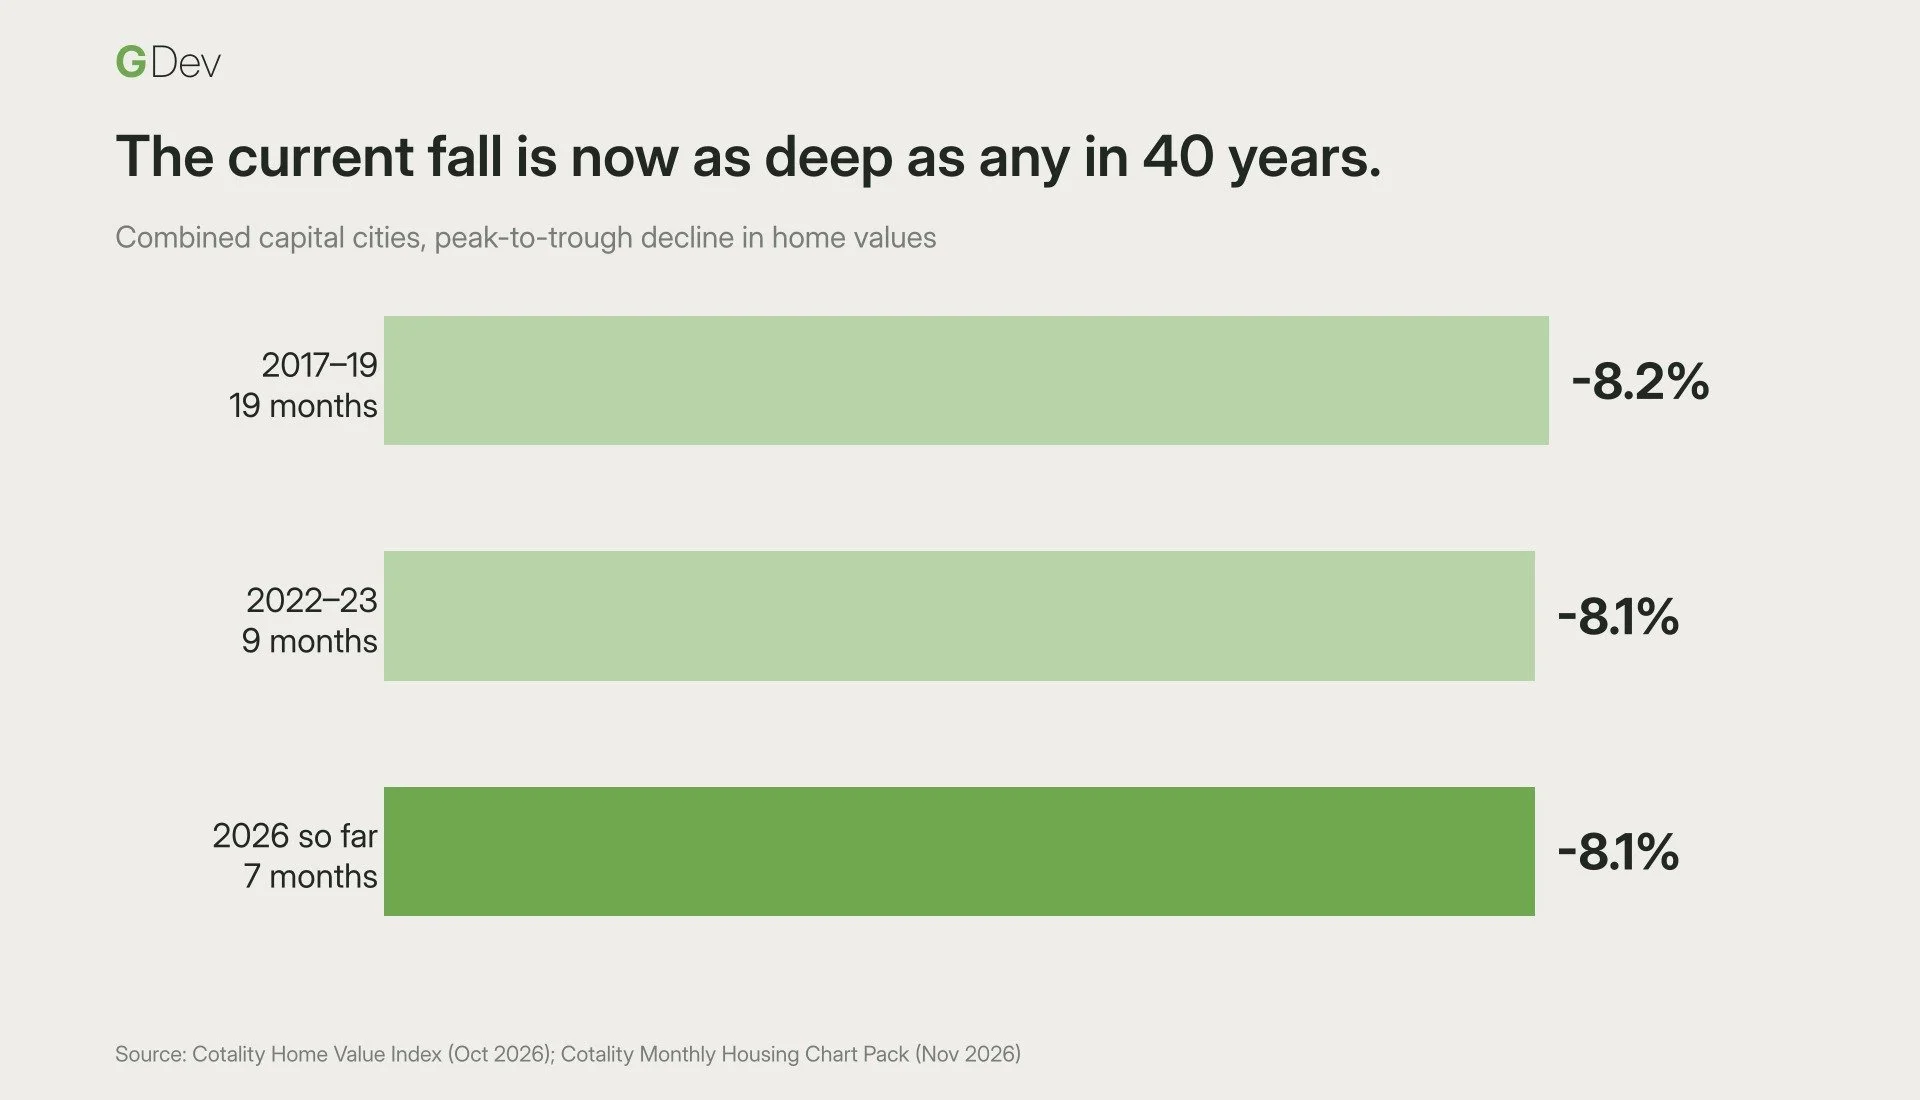
Cotality’s records show the largest peak-to-trough fall in capital city values over the past 40 years was 8.2%, between October 2017 and May 2019 (Cotality, November 2026). More recently, values fell 8.1% over nine months in 2022–23 as interest rates climbed sharply from their pandemic lows (Cotality, May 2026).
The current fall has matched the 2022–23 decline in seven months rather than nine, and Cotality expects it to pass the 2017–19 record in next month’s figures (Cotality, November 2026). The difference this time is speed rather than depth.
What happened after the last two
Neither of those downturns was the end of the story. After falling 7.5% from their April 2022 peak, national home values bottomed out in January 2023. They then rose 8.1% to reach a new record high by November that year, around ten months after the trough (CoreLogic, November 2023).
The 2017–19 fall left housing more affordable, and that set up the next upswing (CoreLogic, 2022). National values rose almost 25% in 2021 alone (Cotality, 2026).
Over a ten-year view, the picture looks very different from the monthly headlines. National home values rose 66.5% in the decade to August 2026. Brisbane values more than doubled, up 111.8%, as did Adelaide (107.1%), while Sydney rose 44.4% and combined regional markets 99.4% (Cotality, September 2026).
None of this guarantees how the current cycle will play out. It does show that falls of this size have happened before, and that each was eventually followed by new highs.
Not every market is moving the same way
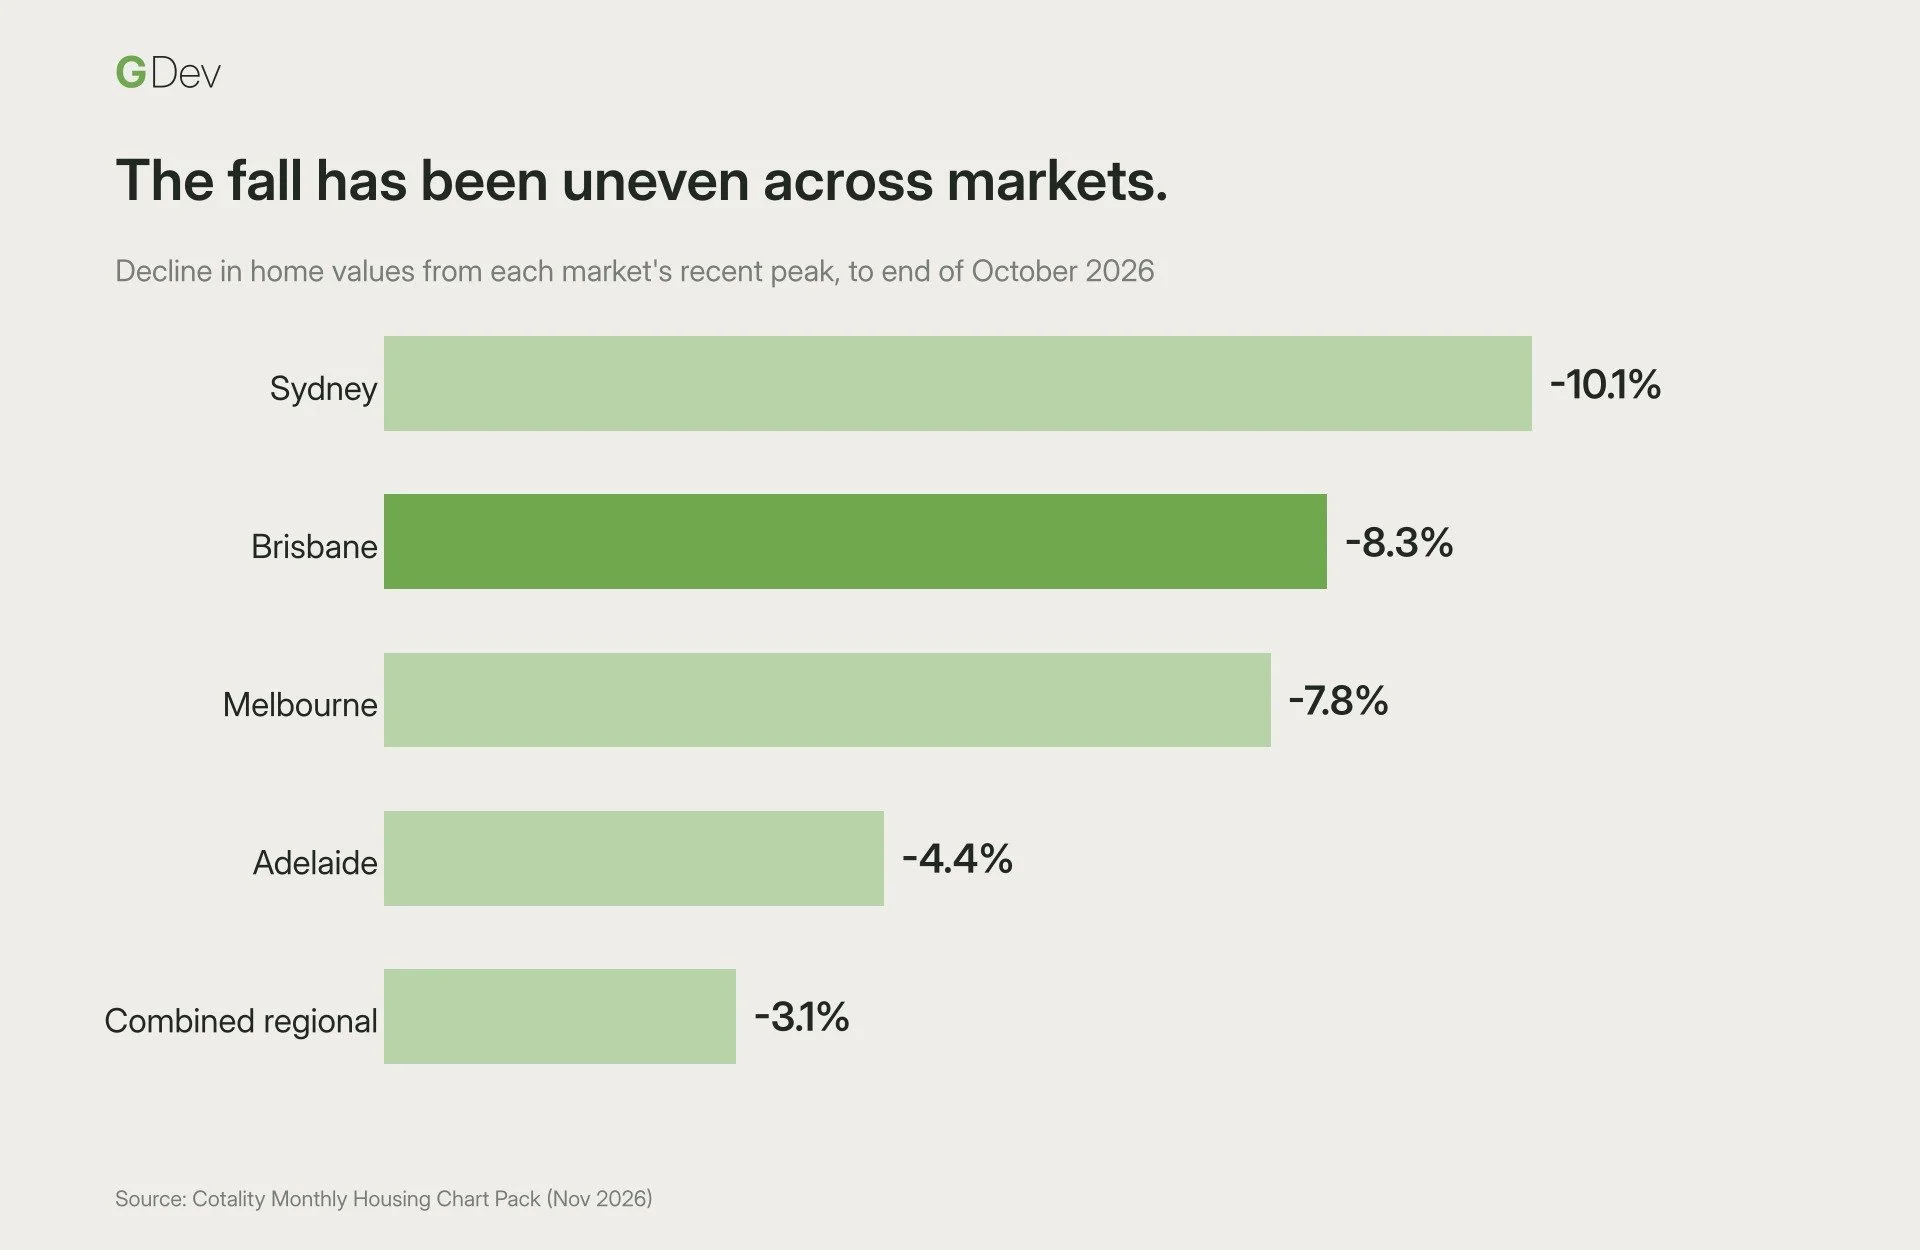
The national figure hides big differences between cities. Sydney has fallen furthest, down 10.1% from its peak, followed by Brisbane (8.3%) and Melbourne (7.8%). Adelaide is down 4.4%, and combined regional markets just 3.1% (Cotality, November 2026).
Cotality describes the mid-sized capitals, including Brisbane and Adelaide, as going through their fastest downturns on record (Cotality, November 2026). These are the same markets that led the growth of recent years, so some cooling is not surprising. Regional markets have held up better. Regional values were still 3.4% higher over the year to October, while capital city values were down 4.8% (Cotality, November 2026).
Why the market is falling
The main pressure is the cost of borrowing. In November the Reserve Bank raised the cash rate for the fifth time this year, to 4.85%. Cotality doesn’t expect rate cuts before the second half of 2027 (Cotality, November 2026). Affordability limits, serviceability and low confidence have all weighed on demand, and the Federal Budget has added pressure since mid-May (Cotality, November 2026).
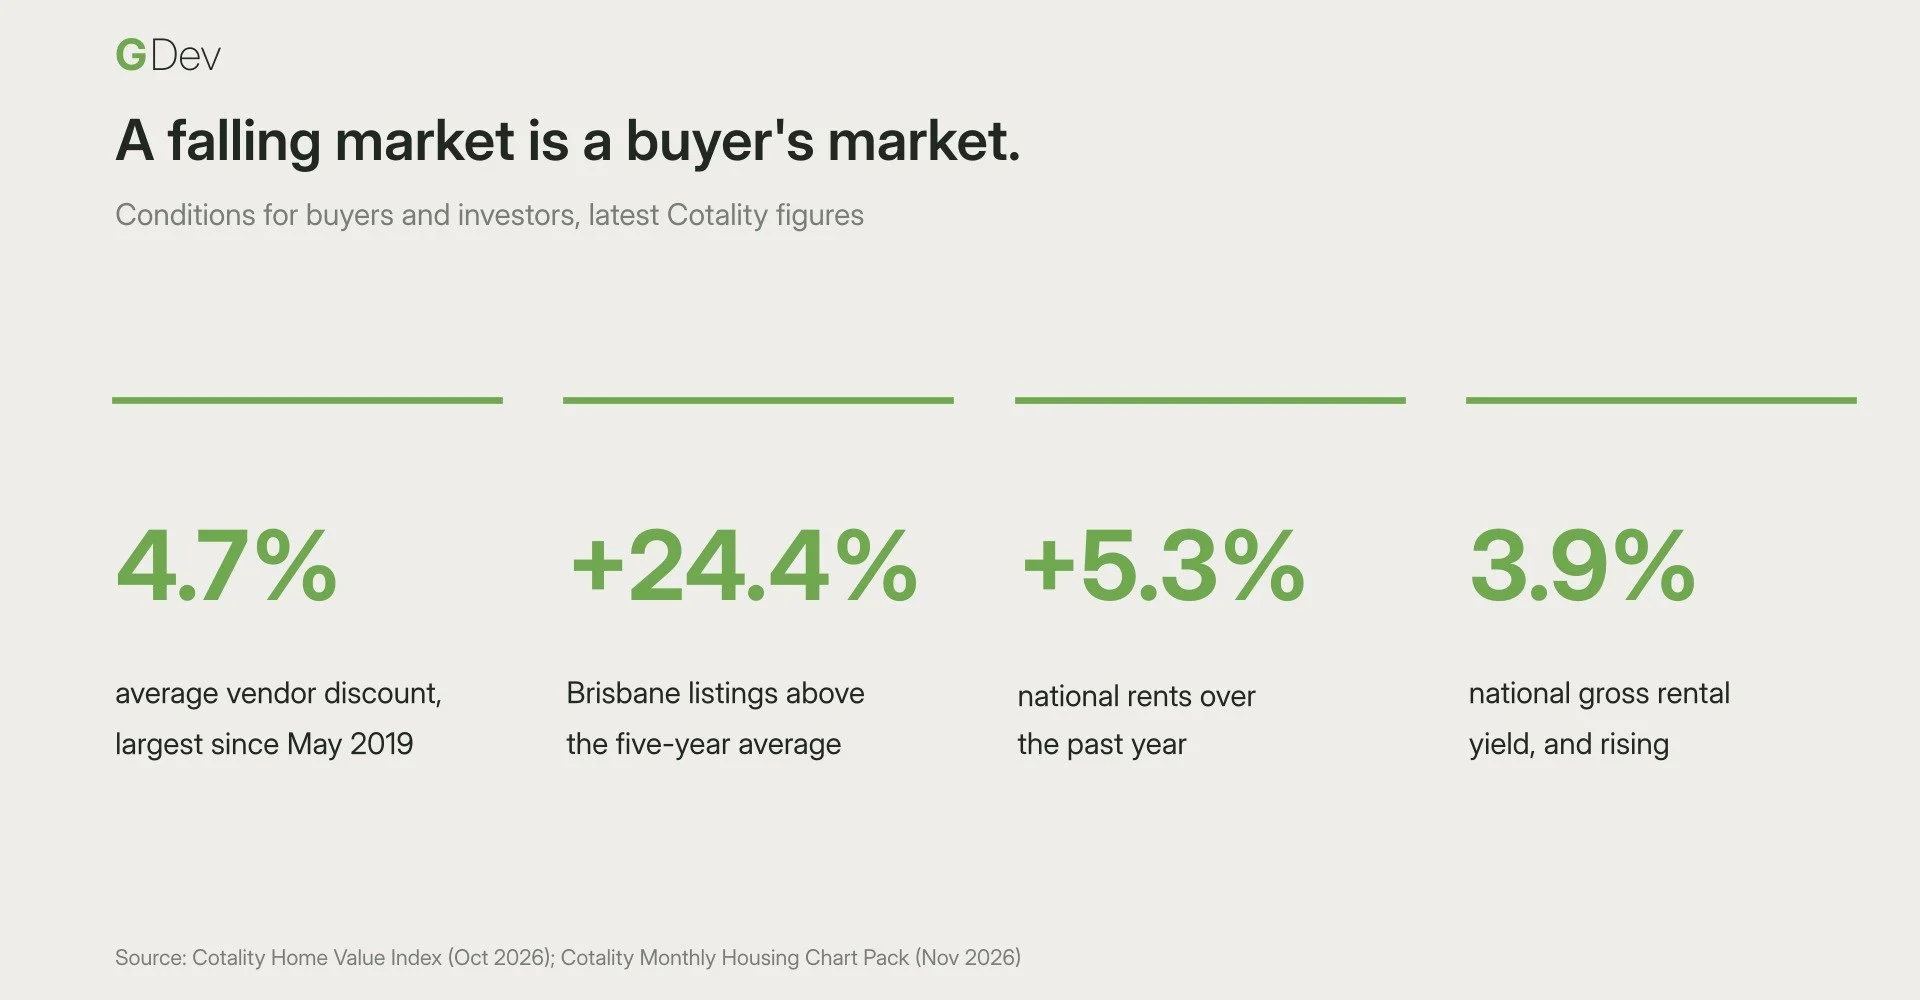
These are cyclical pressures, not structural ones. Australia still needs more homes, and rents keep rising. National rents grew 5.3% over the past year (Cotality, November 2026).
A buyer’s market, for now
For anyone who has the finance and a long-term view, conditions have changed in their favour. Vendor discounts average 4.7%, the largest since May 2019. Homes are taking 39 days to sell, the longest since August 2020 (Cotality, November 2026). In Brisbane, the number of homes for sale is 24.4% above the five-year average (Cotality, November 2026).
As Cotality’s research director Tim Lawless put it, “buyers have a lot more stock to choose from, they have more leverage” (Cotality, November 2026).
Investors also get better income. As values fall and rents rise, the national gross rental yield has climbed to 3.9% (Cotality, November 2026).
What this means for investors
A fall in value only becomes a realised loss when a property is sold. Investors who bought on sound fundamentals, with finance they can carry through higher rates, usually don’t need to act on monthly index movements. The ones who come under pressure tend to be those forced to sell at the wrong point in the cycle.
For investors weighing a purchase now, the same reasoning applies the other way. The questions that matter are the same as in any market:
Can the finance hold up if rates stay higher for longer?
Does the location have the population, jobs and infrastructure to support demand over ten years or more, not ten months?
Will the property attract tenants at a rent that suits the numbers?
At GDev, our build locations are chosen on exactly these fundamentals: population growth, employment, infrastructure and long-term demand. We have been building through market cycles for 20 years, including every downturn covered in this article. What we have learnt is that buyers and partners who plan around the long term usually do better than those who react to each month’s headlines.
If you’re talking to clients who are nervous about the market, or looking for stock in growth corridors while buyers hold more leverage, our team is happy to talk it through.
General information only, not financial advice.
Sources
Cotality, Monthly Housing Chart Pack, November 2026: https://www.cotality.com/au/insights/articles/monthly-housing-chart-pack-november
Cotality, Home Value Index, October 2026 results (published November 2026): https://www.cotality.com/au/insights/articles/housing-downturn-broadens-as-brisbane-and-perth-lead-the-decline
Cotality, Home Value Index, September 2026: https://discover.cotality.com/hubfs/Article-Reports/COTALITY%20HVI%20SEP%202026%20FINAL%20(1).pdf
Cotality, Monthly Housing Chart Pack, May 2026: https://www.cotality.com/au/insights/articles/monthly-housing-chart-pack-may-2026
CoreLogic, national Home Value Index reaches a new record high, November 2023: https://propertyupdate.com.au/v-shaped-recovery-corelogics-national-home-value-index-reaches-a-new-record-high-in-november/
CoreLogic (Tim Lawless), AHURI presentation, 2022: https://www.ahuri.edu.au/sites/default/files/documents/2022-09/CoreLogic%20AHURI%20slides%20TIM%20LAWLESS.pdf
Cotality 40-year analysis, via Real Estate Business, 2026 (source for the 2021 growth figure): https://www.realestatebusiness.com.au/growth/31219-40-years-of-growth-how-australia-s-property-market-defied-the-odds